Innovative Research

Collection of Data Plots
Uncovering the Latest Findings
The building of the Underwater Mammal Classification Identifier focuses on understanding the patterns and underlying features of the data presented in our field of study. We are situated in Ann Arbor, Michigan where we are proud to have created a creative, collaborative and open-minded Engineering Lab of three highly motivated students.

Mel Spectrogram Discussion
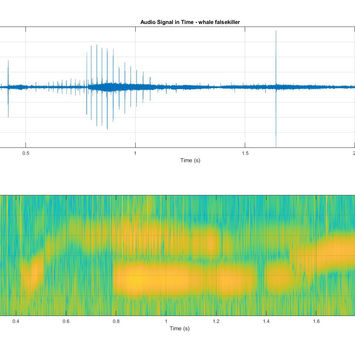
One important DSP tool we implemented when determining which auditory features to abstract for the training of our classifier is the Mel Spectrogram. The Mel Spectrogram is similar to a normal spectrogram however, the frequencies are in units on the Mel scale instead of Hertz (Hz). Humans can distinguish differences in lower Hz values when compared to higher values. For example, it is easier to distinguish 200 Hz from 300 Hz than 10000Hz from 10100Hz. By utilizing the Mel scale, the resulting spectrogram is scaled logarithmically which more accurately represents how well humans are able to distinguish between different auditory frequencies. In Figure A. (bottle_noise_melspec), we can see that the dolphin makes a loud and wide frequency-spanning vocal noise. This knowledge allows for a better definition of an expected frequency range for the dolphin.

Single-Sided Amplitude Graph
Another audio feature included in the classification data is the number of well-defined peaks in a single-sided, amplitude graph. This graph plots the positive amplitude values of a signal with respect to a frequency. Plotting this graph involves performing the FFT of the original signal and then calculating the amplitude/power for the frequency range of 0-22000Hz. Once this is completed, the resulting graph displays noticeable peaks for frequencies with steep amplitudes. Our research shows that dolphins will have more defined peaks at larger frequencies. The shown plots for the mammal species, bottlenose dolphin and humpback whale, support this research. By observing the plots, the dolphin plot demonstrates noticeable peaks at 7000Hz and 13000Hz while the whale shows all peaks contained under 1500Hz. The next step is using this data and applying to the mammal classification algorithm. The goal is that the classifier will be able to find patterns within this peak data which can influence the decisions of the program to then classify between mammal types of dolphins and whales. If this implementation is successful, the hope is to apply the method to identify the selected subspecies within our dataset.

Classification Algorithms
After cutting and preparing our data, the next step is to utilize the MATLAB Classification Learner App to aid us in creating a classifier algorithm. When implementing the program, the current project plan is to test two main categories of classification algorithms: Support Vector Machine and Decision Tree. The categories contain various subcategories that will involve testing as well, if all is successful up to the point. Once an algorithm is selected, an accuracy rating is provided from the program ranging from 0%-100%. The closer the returned value is to 100%, the higher the expected classifier rate is displayed and the algorithm will be able to better classify test data correctly.
Applied Filters
April 20, 2022
Highpass
Our first applied filter with success was the high pass filter. This allowed isolation of the higher frequency mammal voices to be retained, while eliminating the excessive noise of the lower frequency. We started by applying a 5 kHz cutoff frequency, which cut out more of the signal that we were intending to do. This prompted us to explore different options before settling on the 2 kHz cutoff frequency. This allowed us to eliminate some of the noise, but keep some of the lower frequency speaking mammals unmodified. The highpass filter however, would not be sufficient enough to be used by itself, so we design a target moving average filter explained below.

Targeting Moving Average
The targeting moving average filter allowed us to build off the high pass filter applied above. This filter begins by taking an input signal and separating it into two components by applying a highpass and lowpass filter. The highpassed sequence holds most of the audible mammal voice and is kept to be added back in later in the process. The signal from the lowpass sequence contains lower frequency of mammal voices as well as excess noise and echoes from the underwater world. This component is then passed through a moving average filter to smooth the signal and eliminate excess peaks and valleys. The two components are then summed back together to form the final complete signal.

Wiener
The Wiener filter is commonly used for noise reduction in image processing. However, it can also be used for speech enhancement and noise cancellation. The Wiener filter works by minimizing the mean square error between the estimated desired signal and a noisy signal. After inputting the audio signal into the filter, the output sound was much clearer and the noise was noticeably minimized, if not entirely eliminated. The Wiener filter was more likely to return unbiased results compared to the other applied filters.


Additional Plots


